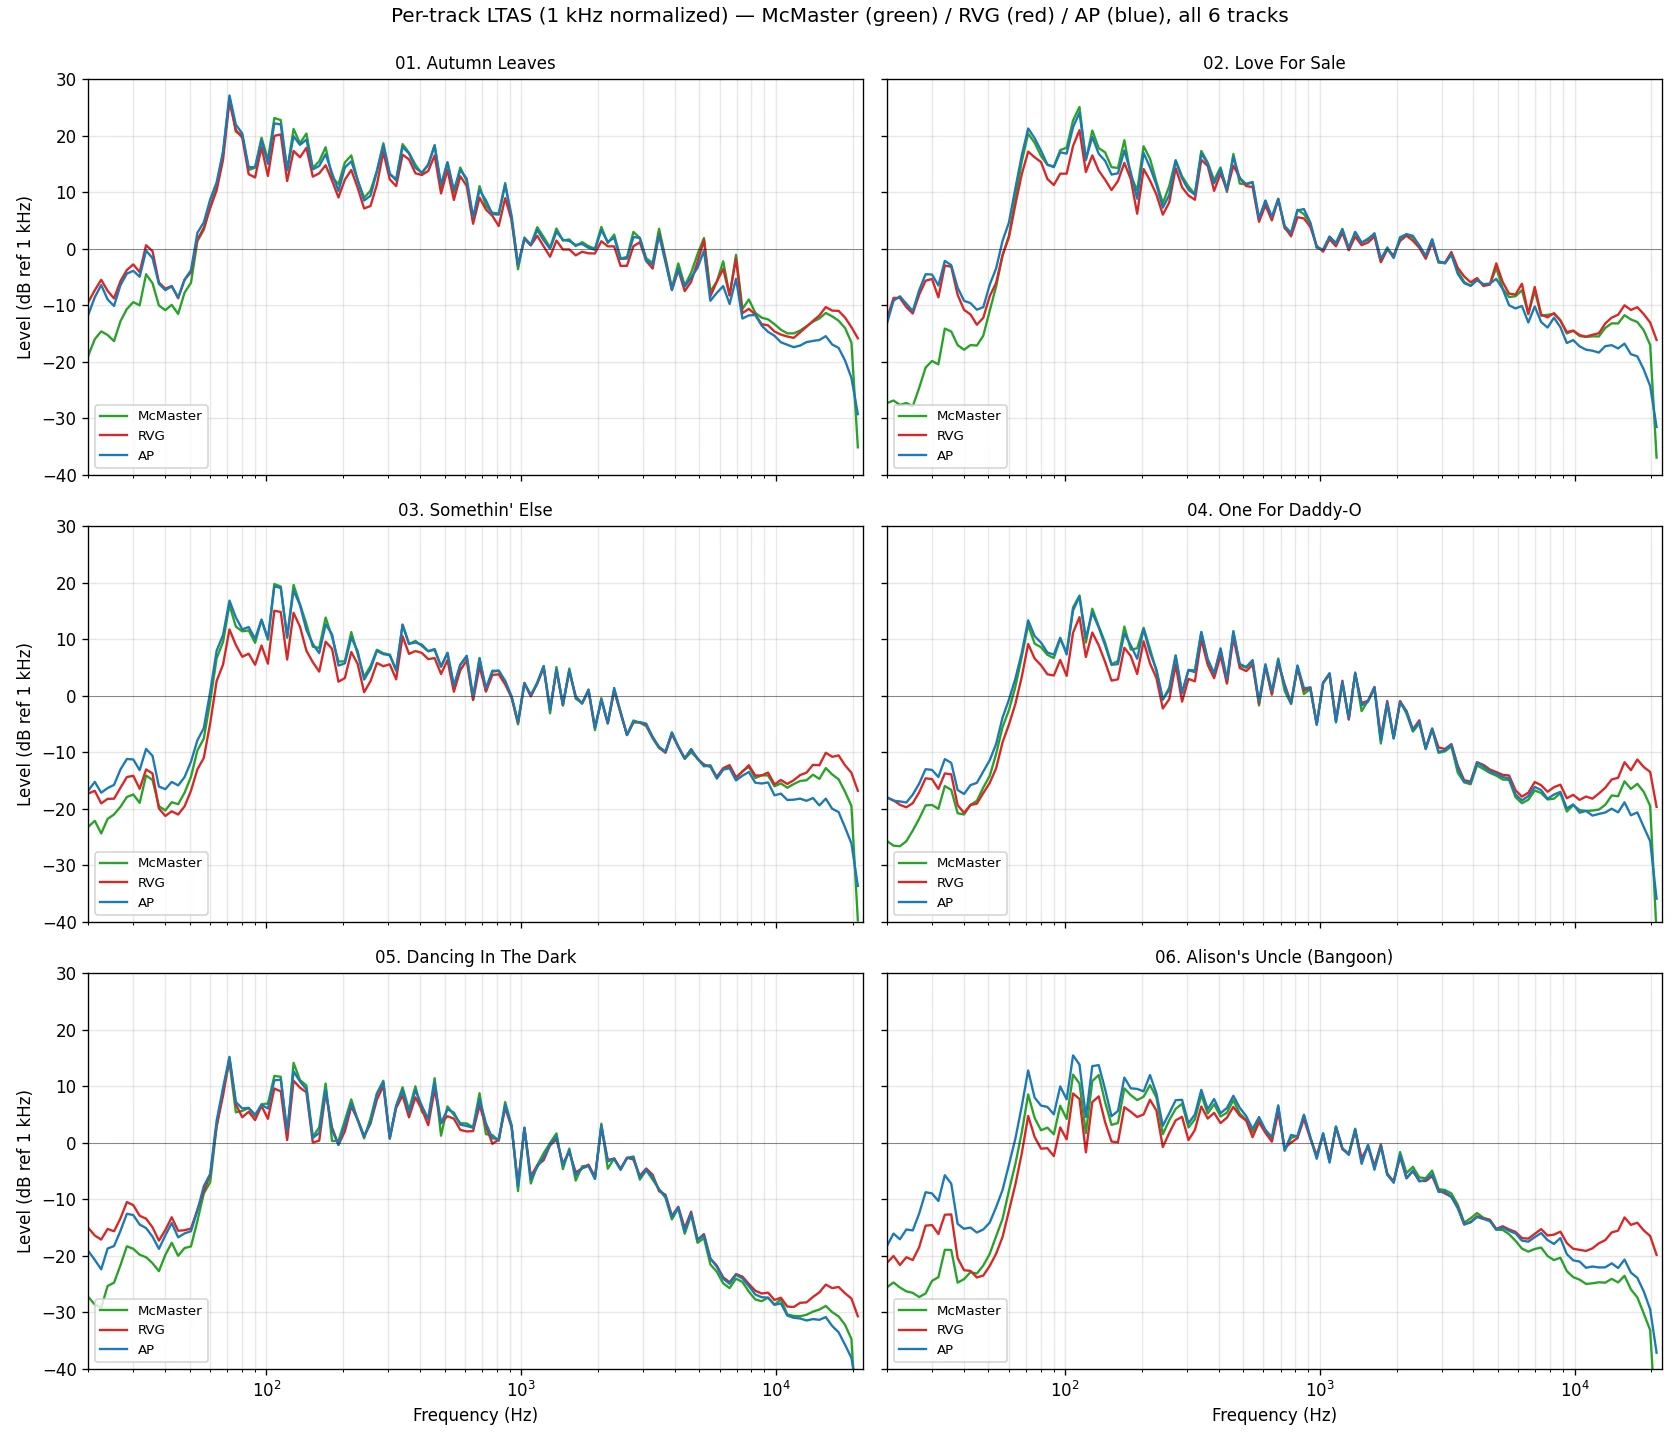
A 3-way LTAS of three *Somethin' Else* CDs — confirming the processing newly added at the RVG Edition 1999 stage
Somethin' Else 3-way LTAS — measuring the processing newly added at the RVG Edition stage
Question answered on this page: Is Van Gelder's mastering-stage sound shaping visible in objective measurement? Three CDs of the 1958 Somethin' Else recording (Cannonball Adderley, 1987 McMaster / 1999 RVG Edition / 2009 AP) are compared via long-term average spectrum (LTAS) to see how the Hoffman interpretation and the LD+3 memo are borne out by what we observe on CD.
← For the prerequisites ("recording- and mastering-stage sound shaping" and "Hoffman's interpretation and the LD+3 memo"), see the related FAQ: Where is the RVG sound made? Recording- and mastering-stage sound shaping
← For the cutting equipment and EQ curve discussion, see the related FAQ: What equipment did Rudy Van Gelder use for cutting?
Measuring the 1958 Somethin' Else
This section is a case study of the central point made in the related FAQ: that "mastering-stage sound shaping is a separate matter from the cutting EQ curve."
The axes of Van Gelder's mastering-stage sound shaping are also visible in objective measurement of digital sources. For Cannonball Adderley's Somethin' Else (Blue Note BST-81595, recorded 1958), the author compared three CD sources arranged in release-year order:
- Capitol / Blue Note 0777 7 46338 2 6 (1987): a CD made in the early CD era by Ron McMaster. The sleeve credit reads "Digital Transfer by Ron McMaster," which is presumed to be a plain transfer from the tape, dating from before the term "remaster" was established
- Blue Note 7243 4 95329 2 2 (1999): RVG Edition, a CD remaster by Van Gelder himself
- Analogue Productions CBNJ 81595 SA (2009): SACD/CD hybrid disc, CD layer, by Kevin Gray + Steve Hoffman. Both engineers have publicly stated their "minimal mastering" philosophy (Steve Hoffman, Tape Op interview), and this disc is also presumed to be a transfer close to "minimal active sound shaping"
(1) is a plain transfer from the early CD era, (2) is a CD remaster by RVG himself, and (3) is a transfer from the recording master with active sound shaping kept to a minimum. The three differ in character.
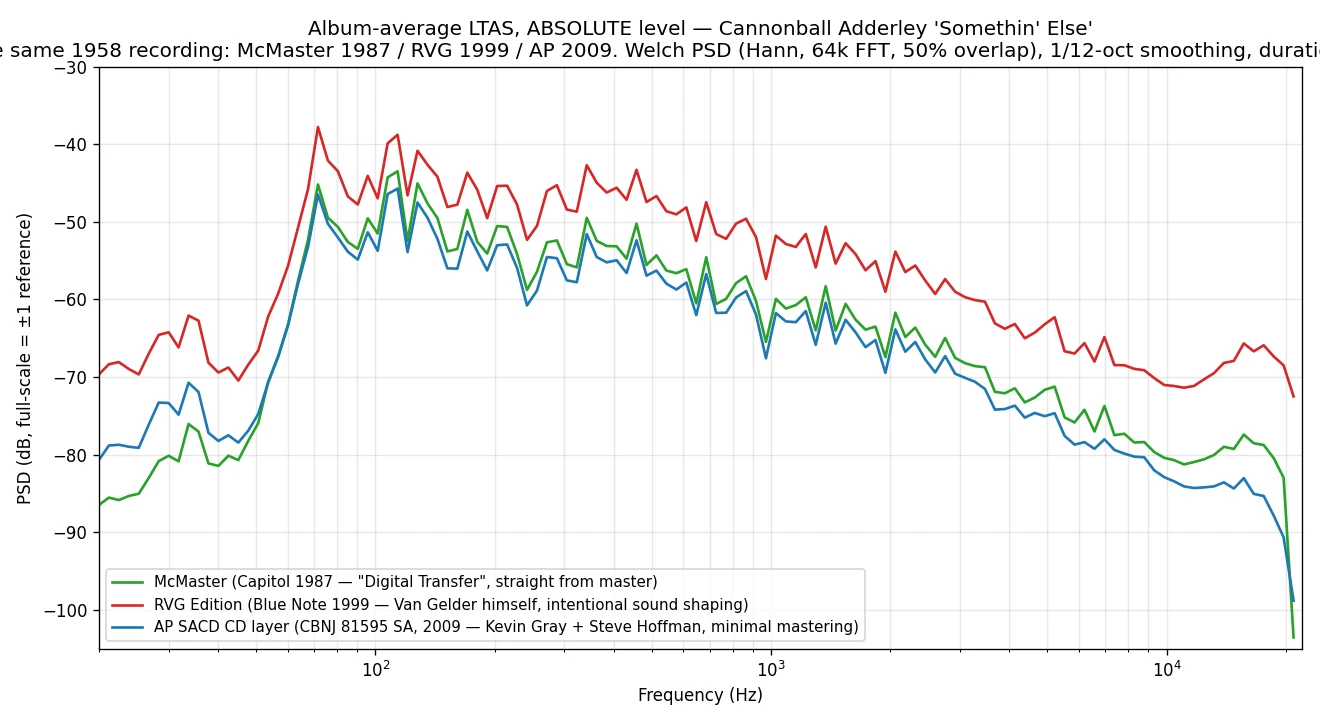
The author's long-term average spectrum (LTAS) comparative analysis of all 6 tracks on these three discs follows (analysis conditions: Welch PSD, Hann window, 64k FFT, 50% overlap, 1/12-octave smoothing, 6-track duration-weighted average).
Loudness and dynamics
| Metric | (1) Mc 1987 | (2) RVG 1999 | (3) AP 2009 |
|---|---|---|---|
| Album-average RMS level | -21.10 dBFS | -15.35 dBFS | -23.06 dBFS |
| Album-average crest factor (peak − RMS) | 20.80 dB | 15.15 dB | 20.45 dB |
| Per-track peak (all 6 tracks) | -2.01 to 0.00 dBFS (natural variation) | -0.18 dBFS for every track | -0.20 to -4.75 dBFS (natural variation) |
(1) and (3) show roughly the same RMS level and roughly the same crest factor, with per-track peaks varying naturally. By contrast, (2) RVG Edition alone is about +6 to +8 dB louder, has a crest factor about 5 dB smaller, and pins all 6 tracks' peaks to the value of -0.18 dBFS. This is strong evidence that limiter / normalization processing has been applied in (2).
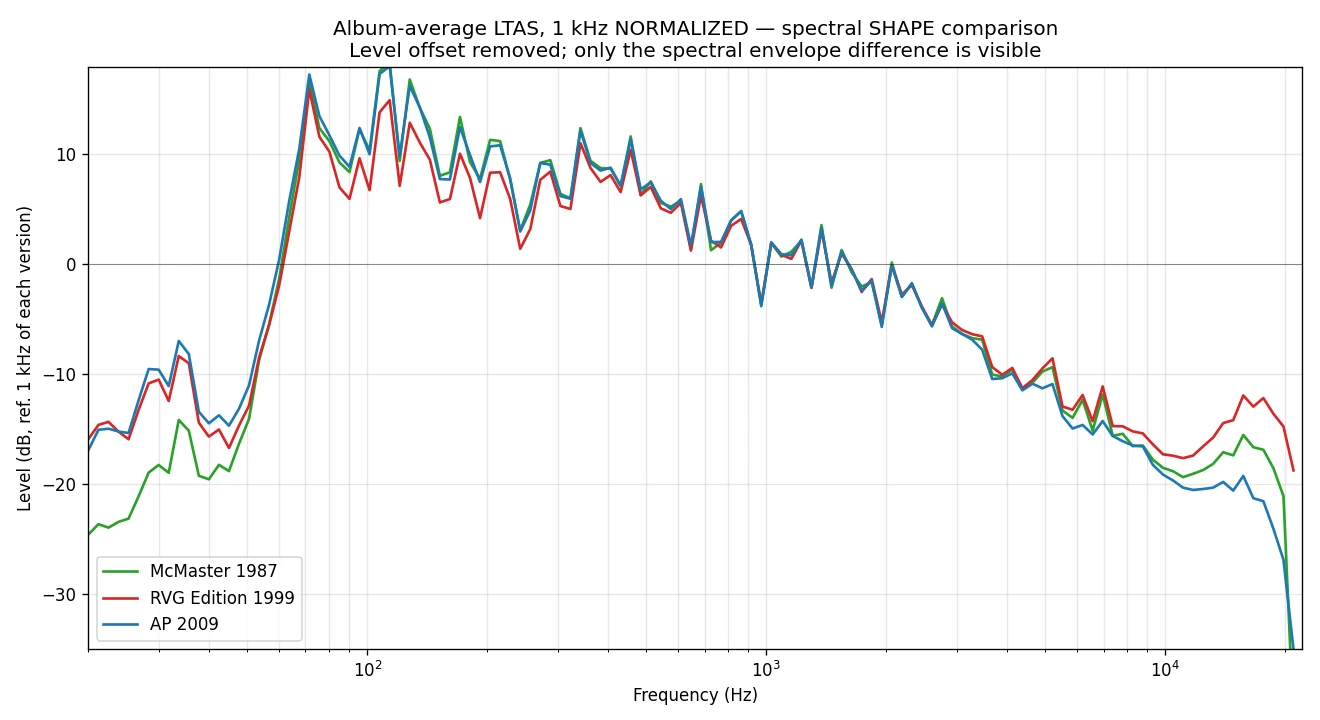
Spectral shape (1 kHz normalized)
| Band | (1) Mc 1987 | (2) RVG 1999 | (3) AP 2009 |
|---|---|---|---|
| 100-200 Hz | +10.4 to +10.8 dB | +7.2 to +7.4 dB | +9.9 to +10.6 dB |
| 500 Hz to 4 kHz | within ±0.5 dB (3 discs match completely) | (same) | (same) |
| 12 kHz | -18.9 dB | -17.1 dB | -20.5 dB |
| 16 kHz | -15.9 dB | -12.3 dB | -20.0 dB |
| 20 kHz | -25.1 dB | -15.5 dB | -28.5 dB |
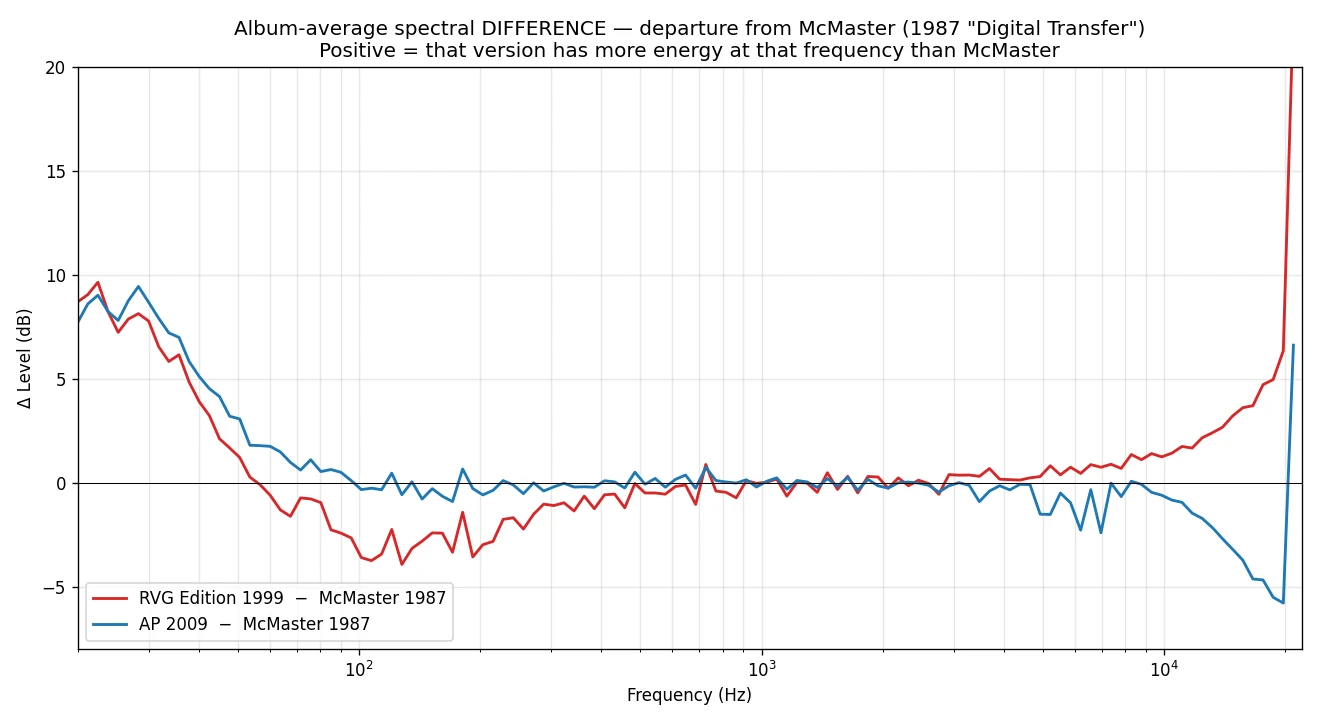
In the midrange (500 Hz to 4 kHz) the 3 discs match completely, which strongly suggests they originate from the same recording master tape (not the LP cutting master). In the low end at 100-200 Hz, (1) and (3) show roughly the same value, and only (2) RVG Edition is reduced by about -3 dB. In the high end, (1) and (2) are relatively close, while (3) AP is somewhat suppressed (likely some kind of noise reduction processing in the recording master tape's hiss region).
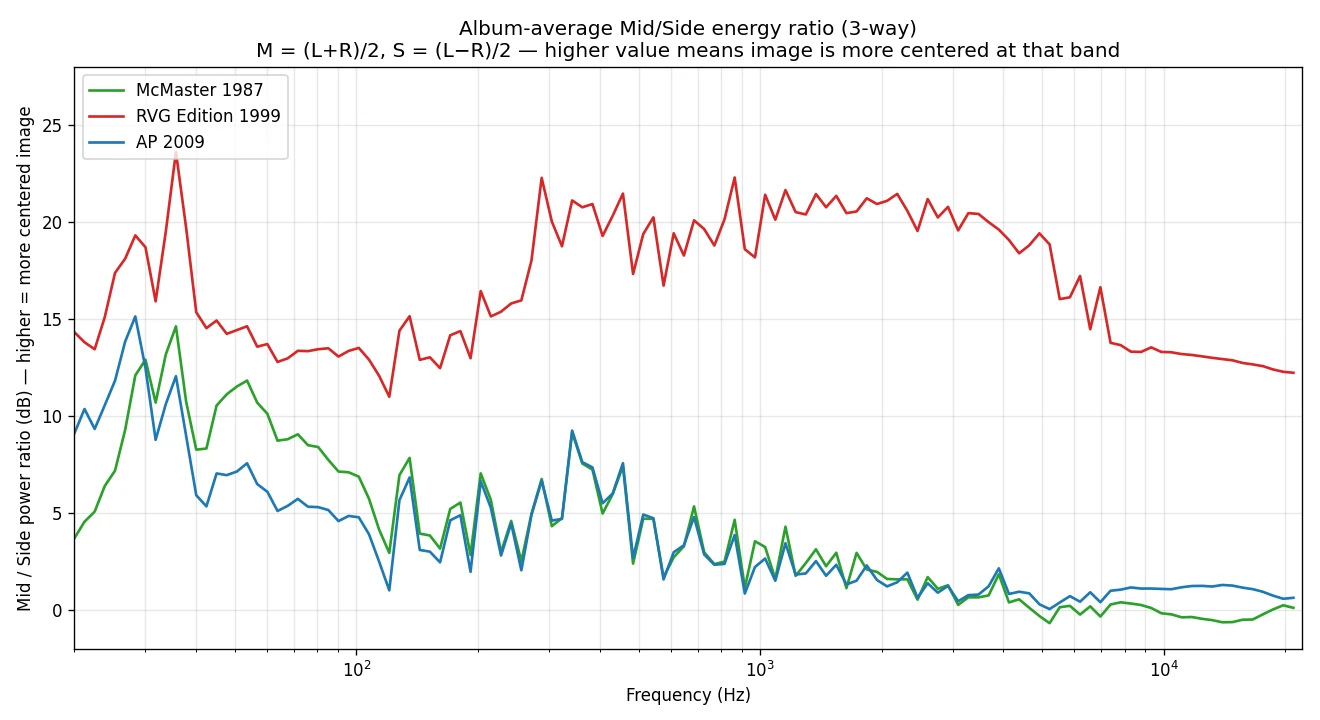
Mid/Side power ratio (degree of stereo image centering)
| Band | (1) Mc 1987 | (2) RVG 1999 | (3) AP 2009 |
|---|---|---|---|
| 500 Hz | +3.6 dB | +18.4 dB | +3.9 dB |
| 1 kHz | +3.4 dB | +19.8 dB | +2.4 dB |
| 2 kHz | +1.8 dB | +21.0 dB | +1.4 dB |
| 4 kHz | +1.2 dB | +19.4 dB | +1.6 dB |
| 8 kHz | +0.4 dB | +13.5 dB | +1.1 dB |
(1) Mc and (3) AP both retain a natural stereo image of about +1 to +4 dB (the wide stereo image of the 1958 recording is alive); whereas (2) RVG Edition alone is on a different order, sitting at +13 to +21 dB and far more centered.
Centering and compression are processing newly added at the RVG Edition CD 1999 stage
One decisive fact emerges from the comparison of the 3 discs.
(1) Mc 1987 is a plain transfer from the early CD era; (3) AP 2009 is a transfer with active sound shaping kept to a minimum. Both retain a natural stereo image and a natural crest factor. That both discs independently show the same property points to a property common to both the recording master tape and the LP cutting master tape, rather than a coincidence of having been made from different master tapes.
Only (2) RVG Edition CD 1999 holds together centering (M/S +14 to +21 dB), compression (limiter + crest factor about -5 dB), and low-end reduction. The 3-disc comparison objectively confirms that these are processing newly added at the remastering stage of (2) the RVG Edition CD (1999).
Three anchors (Hoffman's interpretation, LD+3 memo, 3-way LTAS) — what they show together
Hoffman's 5 items (Hoffman's interpretation as published on the web, cited in the related FAQ Where is the RVG sound made? Recording- and mastering-stage sound shaping), the LD+3 memo Van Gelder himself left behind (a primary source from the LP cutting stage), and this section's 3-way LTAS (objective observation at the CD stage), arranged side by side, look as follows.
| Hoffman's claim (interpretation) | LD+3 memo (primary source, LP stage) | 3-way LTAS (observation, CD stage) |
|---|---|---|
| (1) at least 3:1 dynamic range compression | Compression ratio 8:1 | RVG alone is +6 to +8 dB louder + all-track peak pinned to -0.18 dBFS, Mc/AP are natural |
| (2) +5 to +6 dB boost in upper midrange (3-6 kHz) | High EQ +5 dB @ 5,000 c/s | All 3 discs show ±0.5 dB or less difference at 1-4 kHz |
| (3) boomy boost in upper bass | (not stated) | At 100-200 Hz, Mc and AP are equivalent, RVG is about -3 dB |
| (4) cut of low bass + tip top end | Low freq cutoff 45 c/s, High freq cutoff 12,000 c/s | 50 Hz partly matches / high-end suppression is mainly from AP's noise reduction |
| (5) center channel collapse | (not stated) | M/S +14 to +21 dB is RVG alone; Mc/AP show natural stereo image at +1 to +4 dB |
(1) compression and (5) centering were confirmed by 3-way LTAS as new processing introduced at the RVG Edition CD 1999 stage. The LD+3 memo, meanwhile, is a primary source showing that Van Gelder had already applied specific and strong processing at the LP cutting stage as well: compression 8:1, high EQ +5 dB @ 5,000 c/s, low cutoff 45 c/s, high cutoff 12,000 c/s.
LD+3 is a memo for Lou Donaldson's 1959 recording, not a direct record of the processing applied to the original LP cutting of the 1958 Somethin' Else recording. So the LP-to-CD continuity within a single work remains in the realm of inference. What Hoffman's interpretation, the LD+3 memo, and the 3-way LTAS (three different anchors) show in common is consistent with the reading that Van Gelder was an engineer who actively shaped sound in both the LP era and the CD era, pursuing "the sound he believed in at that point in time" for each medium in turn.
"A spectrum of straightness": McMaster ≧ AP ≫ RVG Edition
Arranged by straightness, the 3 discs' sound shaping orders as follows.
- Most straight: (1) McMaster 1987: A "Digital Transfer," as the sleeve credit literally indicates. A plain transfer that includes the recording master tape's hiss
- Almost straight: (3) AP 2009: Consistent with the Kevin Gray + Steve Hoffman "minimal mastering" approach. Not entirely untouched, however: there is some kind of noise reduction processing in the very high end
- Prominent sound shaping: (2) RVG Edition 1999: Of the 3 discs, the only one with active sound shaping (loudness, compression, centering, low-end reduction) added
The cutting EQ curve and sound shaping are separate matters
The foregoing leads to a simple summary:
- The cutting EQ curve has been consistent as RIAA from early 1955 onward, based on equipment records and Van Gelder's own testimony (→ What equipment did Rudy Van Gelder use for cutting?)
- The sonic shaping done in the mastering stage (whether for LP cutting masters or for CD remasters) is a process independent of the cutting EQ curve. The centering, compression, and low-end reduction observed above are all processing newly added at the (2) RVG Edition CD 1999 stage, as confirmed by objective measurement
- Perceptual differences such as "the original sounds different from the reissue" or "CD A sounds different from CD B" are not, on their own, grounds for inferring a difference in the cutting EQ curve
→ What factors besides the EQ curve affect the sound of a record?
Further reading
- Where is the RVG sound made? Recording- and mastering-stage sound shaping — The recording- and mastering-stage sound shaping (Hoffman's interpretation, LD+3 memo, JazzWax interviews) that provides the context for this FAQ's LTAS measurements
- What equipment did Rudy Van Gelder use for cutting? — RVG's cutting equipment lineage, the AES → RIAA transition, and Van Gelder's own 1955 Down Beat testimony
- EQ curve vs. mastering — which determines the sound? — A conceptual organization of how large the mastering-stage influence is
- What factors besides the EQ curve affect the sound of a record? — How each stage of the signal chain affects the sound
Acknowledgments
This FAQ belongs to a four-part set on RVG cutting and mastering. Richard Capeless of RVG Legacy provided advice and review comments that shaped the revision and split. My thanks for the help.
Revision History
- June 1, 2026: Split off the recording- and mastering-stage sound shaping (Hoffman's interpretation, LD+3 memo, JazzWax interviews) into a new FAQ Where is the RVG sound made? Recording- and mastering-stage sound shaping. This FAQ now focuses on the 3-way LTAS measurement case study of the 1958 Somethin' Else recording
- May 21, 2026: Removed an unsourced date from the description of when Billy Taylor recorded at Van Gelder's studio
- May 11, 2026: Initial publication (split off from the FAQ "What equipment did Rudy Van Gelder use for cutting?" by separating "The 'RVG sound' is not about the EQ curve," "Measuring the 1958 Somethin' Else," and "The cutting EQ curve and sound shaping are separate matters" into a standalone FAQ)