Things I learned on Phono EQ curves, Pt. 25
EQカーブの歴史 や ディスク録音の歴史を、私が学ぶ過程を記録した本シリーズ。前回 Pt.24 では、録音チェーンおよび再生環境における周波数応答特性や位相特性が変化しうるパターンについて調べ、可変イコライザ等の使用による音作りが(特にポピュラー音楽系で)多く行われていることを改めて学びました。また、各種CDリイシュー音源の比較により、当時のシングルマスター、当時のLPマスター、マルチトラックマスターからのリマスター、などを比較することで、ディスク録音イコライザを通過する前の音の違いが確認できることも紹介しました。
This series have documented my process of learning the history of EQ curves and disc recording. In the previous Pt.24, I examined the patterns in which frequency response characteristics and phase characteristics can be changed in the recording chain and reproducing environment, and I learned again that the sound creation (especially in popular music) is often done through the use of variable equalizers and the like. I also introduced the comparison of various CD reissues to confirm the differences in sound between single masters of the time, LP masters of the time, remastered from multi-track masters, etc., before passing through the disc recording equalizer.
最終回 となる今回 Pt.25 は、2年以上に及び調べ学んできた膨大な内容を総括した 要約(復習)です。諸説多きディスク録音EQカーブについて、現時点で分かっていることを整理し、現時点での私の理解に基づき、最後に結論めいたものを記しています。また、少しでも読みやすくするため、仮想キャラ2名によるカジュアルな対話形式を挿入してみました(笑)
This Pt.25, which will be the final part, is a summary of the vast amount of information that I have learned and researched over the past two years. I will then summarize what is currently known — and some tentative summary and conclusion based on my current understanding of many thories — about the EQ curves of disc recordings. Also, in order to make it as easy to read as possible, I have inserted casual dialogues between two virtual characters 🙂
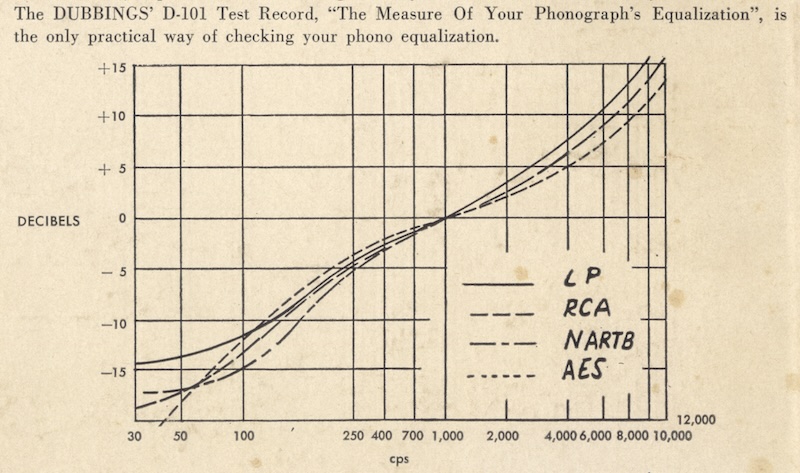
source: The Measure of Your Phonograph’s Equalization (Dubbings D-101, 1953)
from my own collection
